Precise Timelines
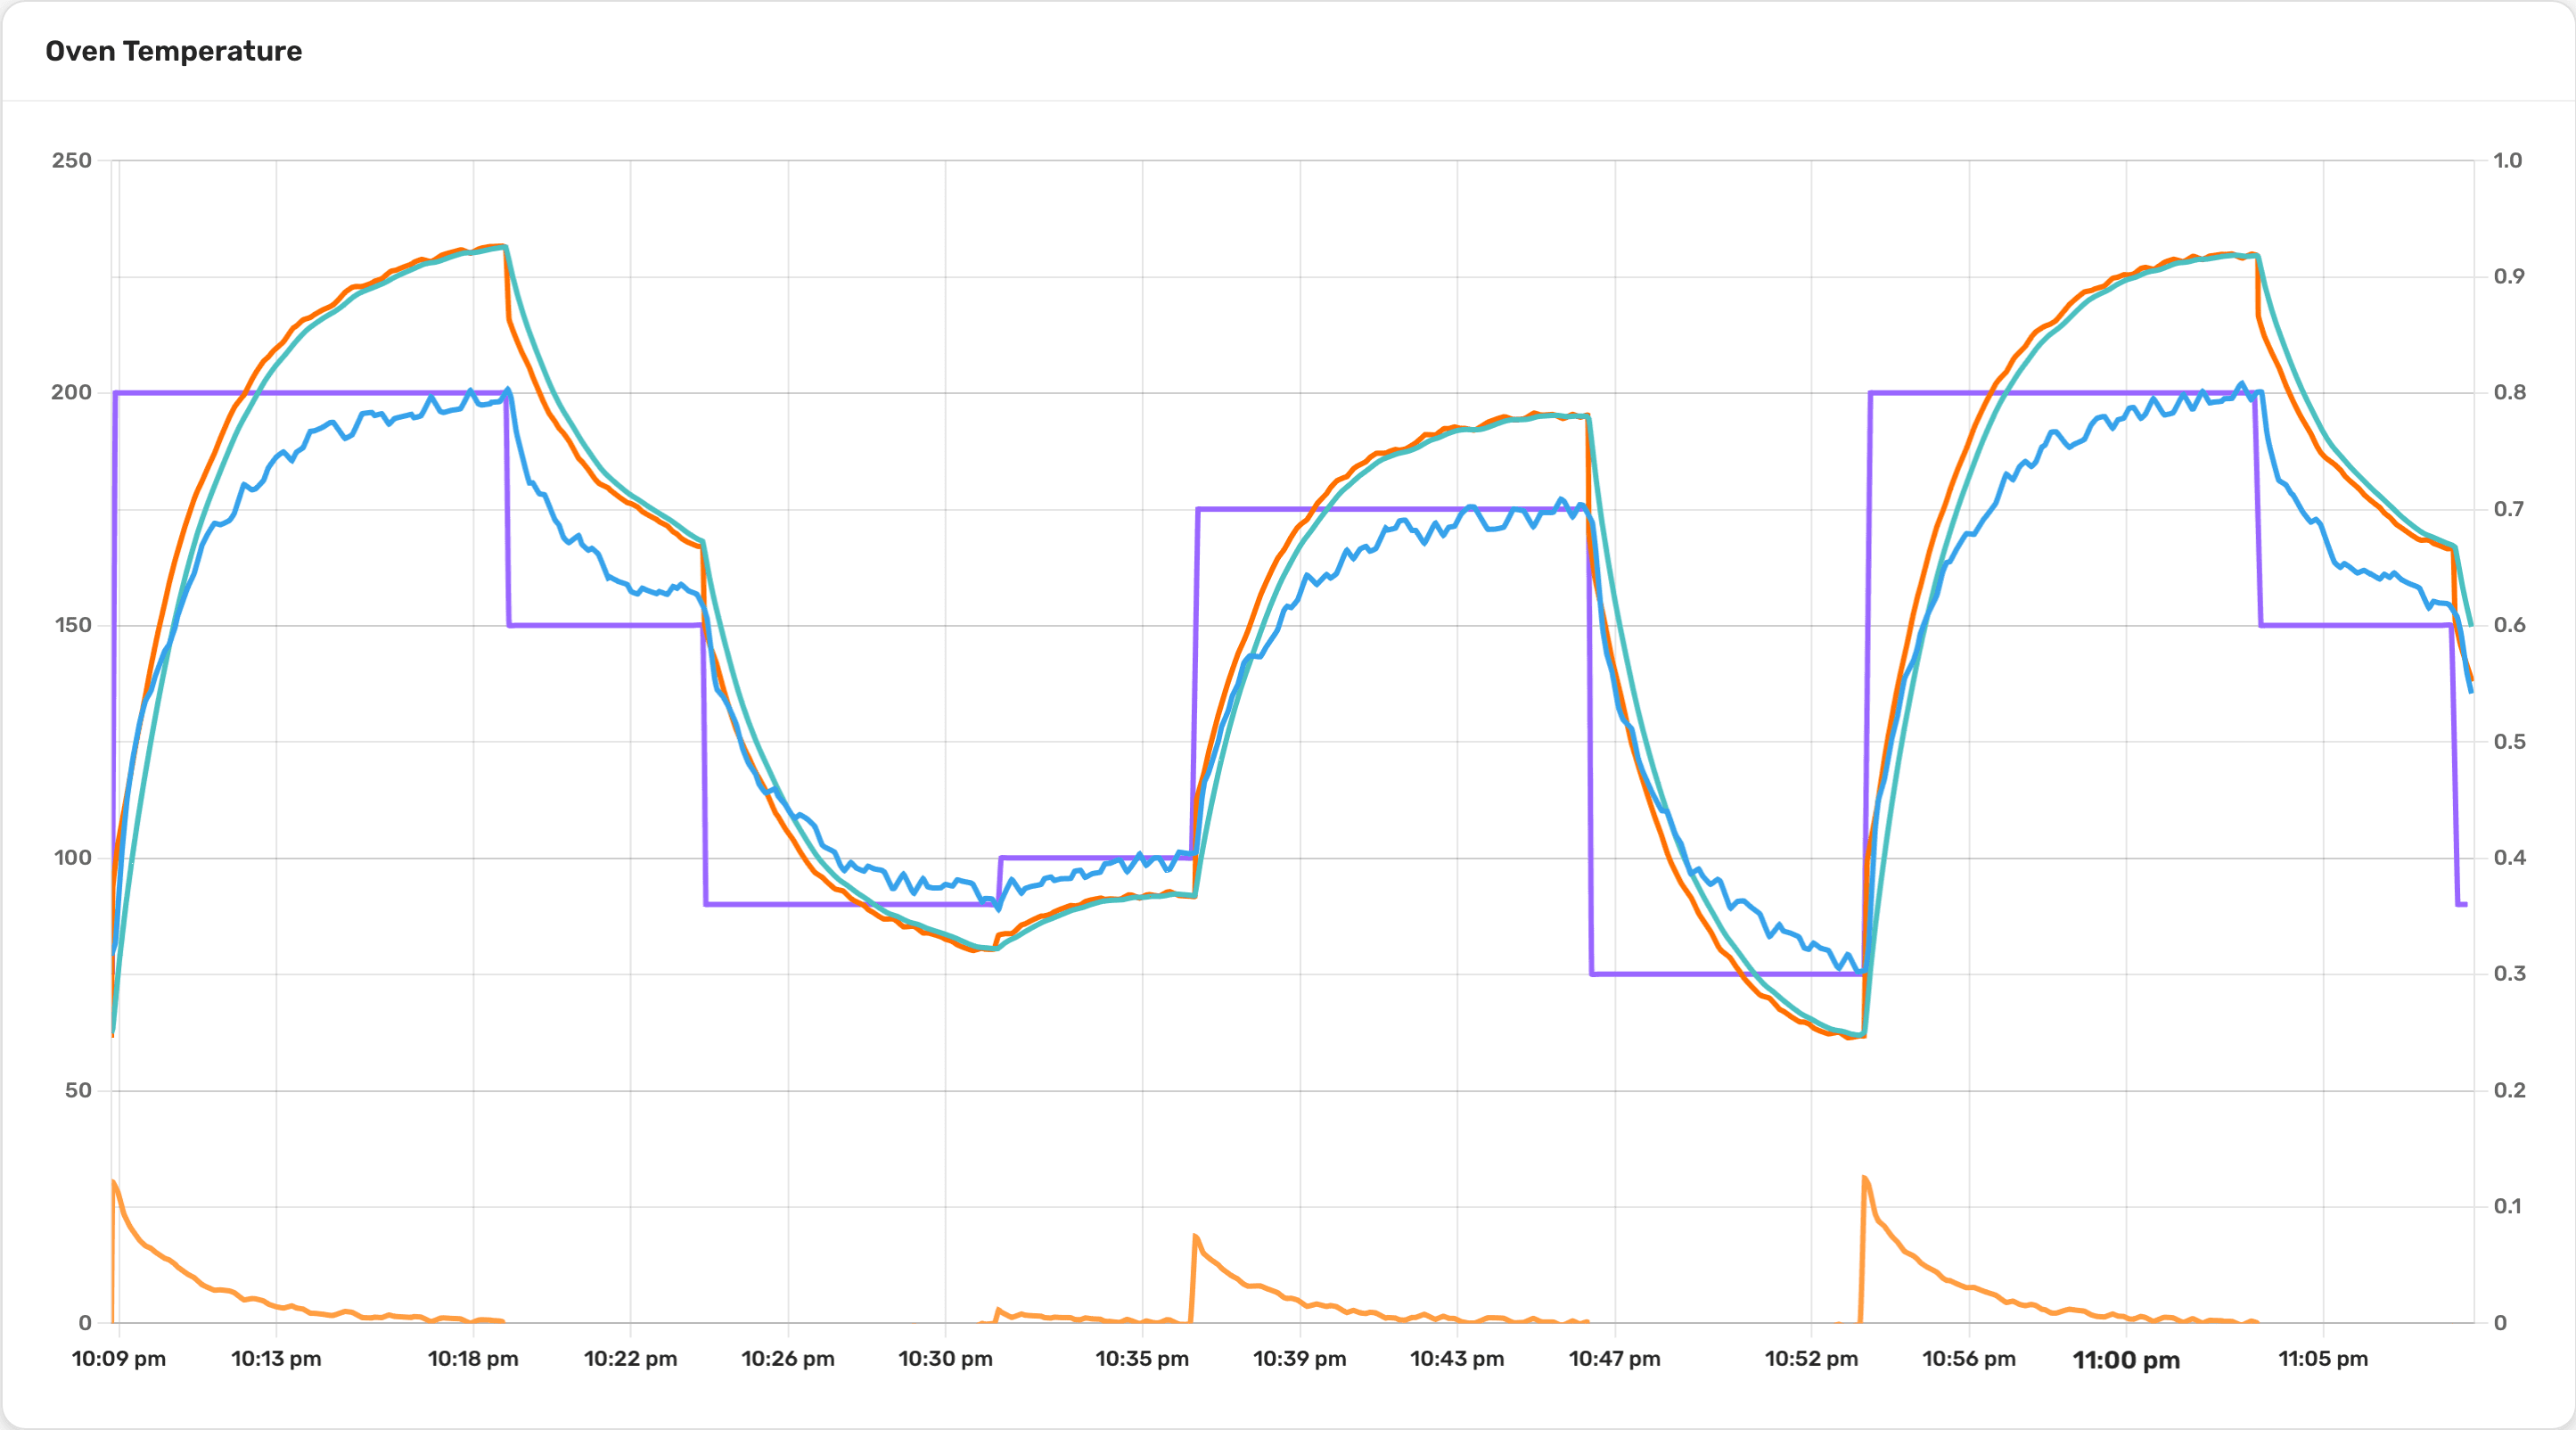
Charts
Bar graphs allow users to compare data side by side, such as set-points and feedbacks, or motor torques on a line.
- Blazing Fast.
- We pride ourselves on the ability to recall historical data, faster than other SQL-based database engines. This allows you to quickly view trends and make decisions based on the data.
- Historical Data.
- With the help of charts, you can view changes in data over long amounts of time. This can be used to make pre-emptive repairs before failures occur, for example motor vibration analysis.
- Time Scrubbing.
- Using our built-in time scrubber, you can quickly scroll through time and zoom-in on specific areas of interest. This can be used to quickly troubleshoot process anomalies within a specific time frame.
- Process Performance Tuning.
- Using the historical features of INDAQ, you can quickly identify areas of improvement in your process. This can be used to increase efficiency and reduce waste.
Everything you need
All-in-one platform
INDAQ comes with all the tools needed to manage your data.
- Team Management
- Invite your team members to collaborate on your charts and dashboards.
- Role based permissions
- Control who can view and/or edit your data and dashboards.
- Data Exports
- Use our tools to export your raw data in various readable formats.
Snapshot Views
Dashboards
With dashboards you can view near real time snapshots of your current data. Each dashboard has individually customizable tiles, that managers can design to fit their needs.
- Numerical Tiles.
- These tiles can be customized to display the latest data from a specific parameter. Edit the displayed name and units as needed.
- State Based Tiles.
- State based tiles allow you display text and color based on the current numeric value of a parameter. This can be used for displaying toggle switches or other machine states.
Get Started Quickly
How It Works
From installation to insights in four simple steps. Get your data flowing and start optimizing your operations.
Connect Interface
Install the INDAQ interface on your network. Our hardware seamlessly connects to your existing PLCs and controllers.
Configure Parameters
Select which data points to monitor. Our intuitive setup wizard guides you through parameter mapping and naming.
Visualize Data
Access your dashboards, charts, and bar graphs from anywhere. See real-time and historical data instantly.
Optimize Process
Use insights to detect issues early, reduce downtime, and continuously improve your operations.
Rapid Comparisons
Bar Graphs
Quick visual snapshots of process performance and comparisons of parameters.
- Comparisons.
- Quickly compare valuable information, like machine temperatures, production shift counts and other specific data points unique to your business.
- Grouping.
- Group similar data sections together to easily visualize a process. This can be used to quickly identify areas of improvement.
- Customizable.
- Each bar graph can be customized to display only the data you need. This can be used to quickly identify areas of improvement.

Ready to get started?
Be in control of your entire process by detecting issues before they happen. Eliminate downtime and increase efficiency.
Simple no-tricks pricing
INDAQ provides a simple usage based pricing model with a one-time setup fee associated with ordering an interface.
Interface
INDAQ's gateway to your network.
What's included
- Growing support for protocols
- Setup Guide
- Network Configurations
Usage
Only pay for the data you ingest that month.
What's included
- Unlimited Users
- Unlimited Dashboards
- Unlimited Charts
- Unlimited Bar Graphs
- Unlimited Read Access
Support
Frequently Asked Questions
Have questions? We've got answers. If you don't see what you're looking for, feel free to contact us.
INDAQ supports a growing list of industrial protocols:
- drive.web
- Modbus/TCP
- Allen-Bradley - Ethernet/IP
- Allen-Bradley - PCCC
See our parameters documentation for more information. Missing a protocol? Contact us to discuss your needs.
Still have questions? Contact our team →