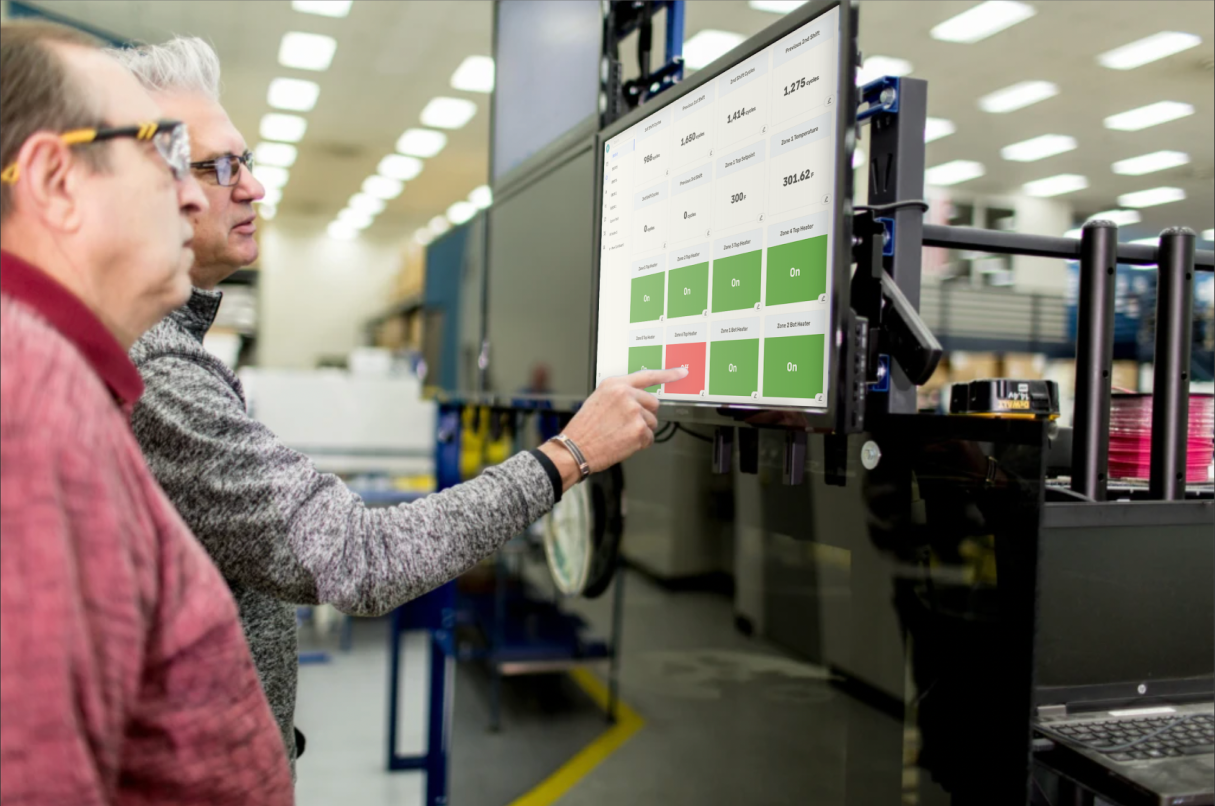
Dashboards
View machine health and performance with realtime metrics.
Access snapshots of historical dashboards from any point in time.
Customize your visuals with states based on machine values.
To learn more,
try out our demo
Click here to start
INDAQ
Interface
Out of the box ready to use. Keep track of all processes and increase productivity with INDAQ.
Simple to setup,
easy to use
Organizations
Create your organization, add users and assign permissions to manage all functions of your opperation.
Projects
Assign a project to an interface to transmit real time data from your machines to your INDAQ account.
Parameters
Setup dashboards, bar graphs and charts with parameters. Select an interval, protocol, IP, value type, ID, scale and tag to begin routing live data to INDAQ's visualization tools.
Queries
Track down and pinpoint specific machine activity with custom queries.