Bar Graphs
Bar graphs show the latest value of several parameters side by side, so they can be compared at a glance. They work well for comparing set-points with their feedbacks, the temperatures of each zone of an oven, or the counts from each production shift.
Where Charts show how your data has changed over time, a bar graph is a live snapshot. Each bar is the most recent value INDAQ has received for its parameter.
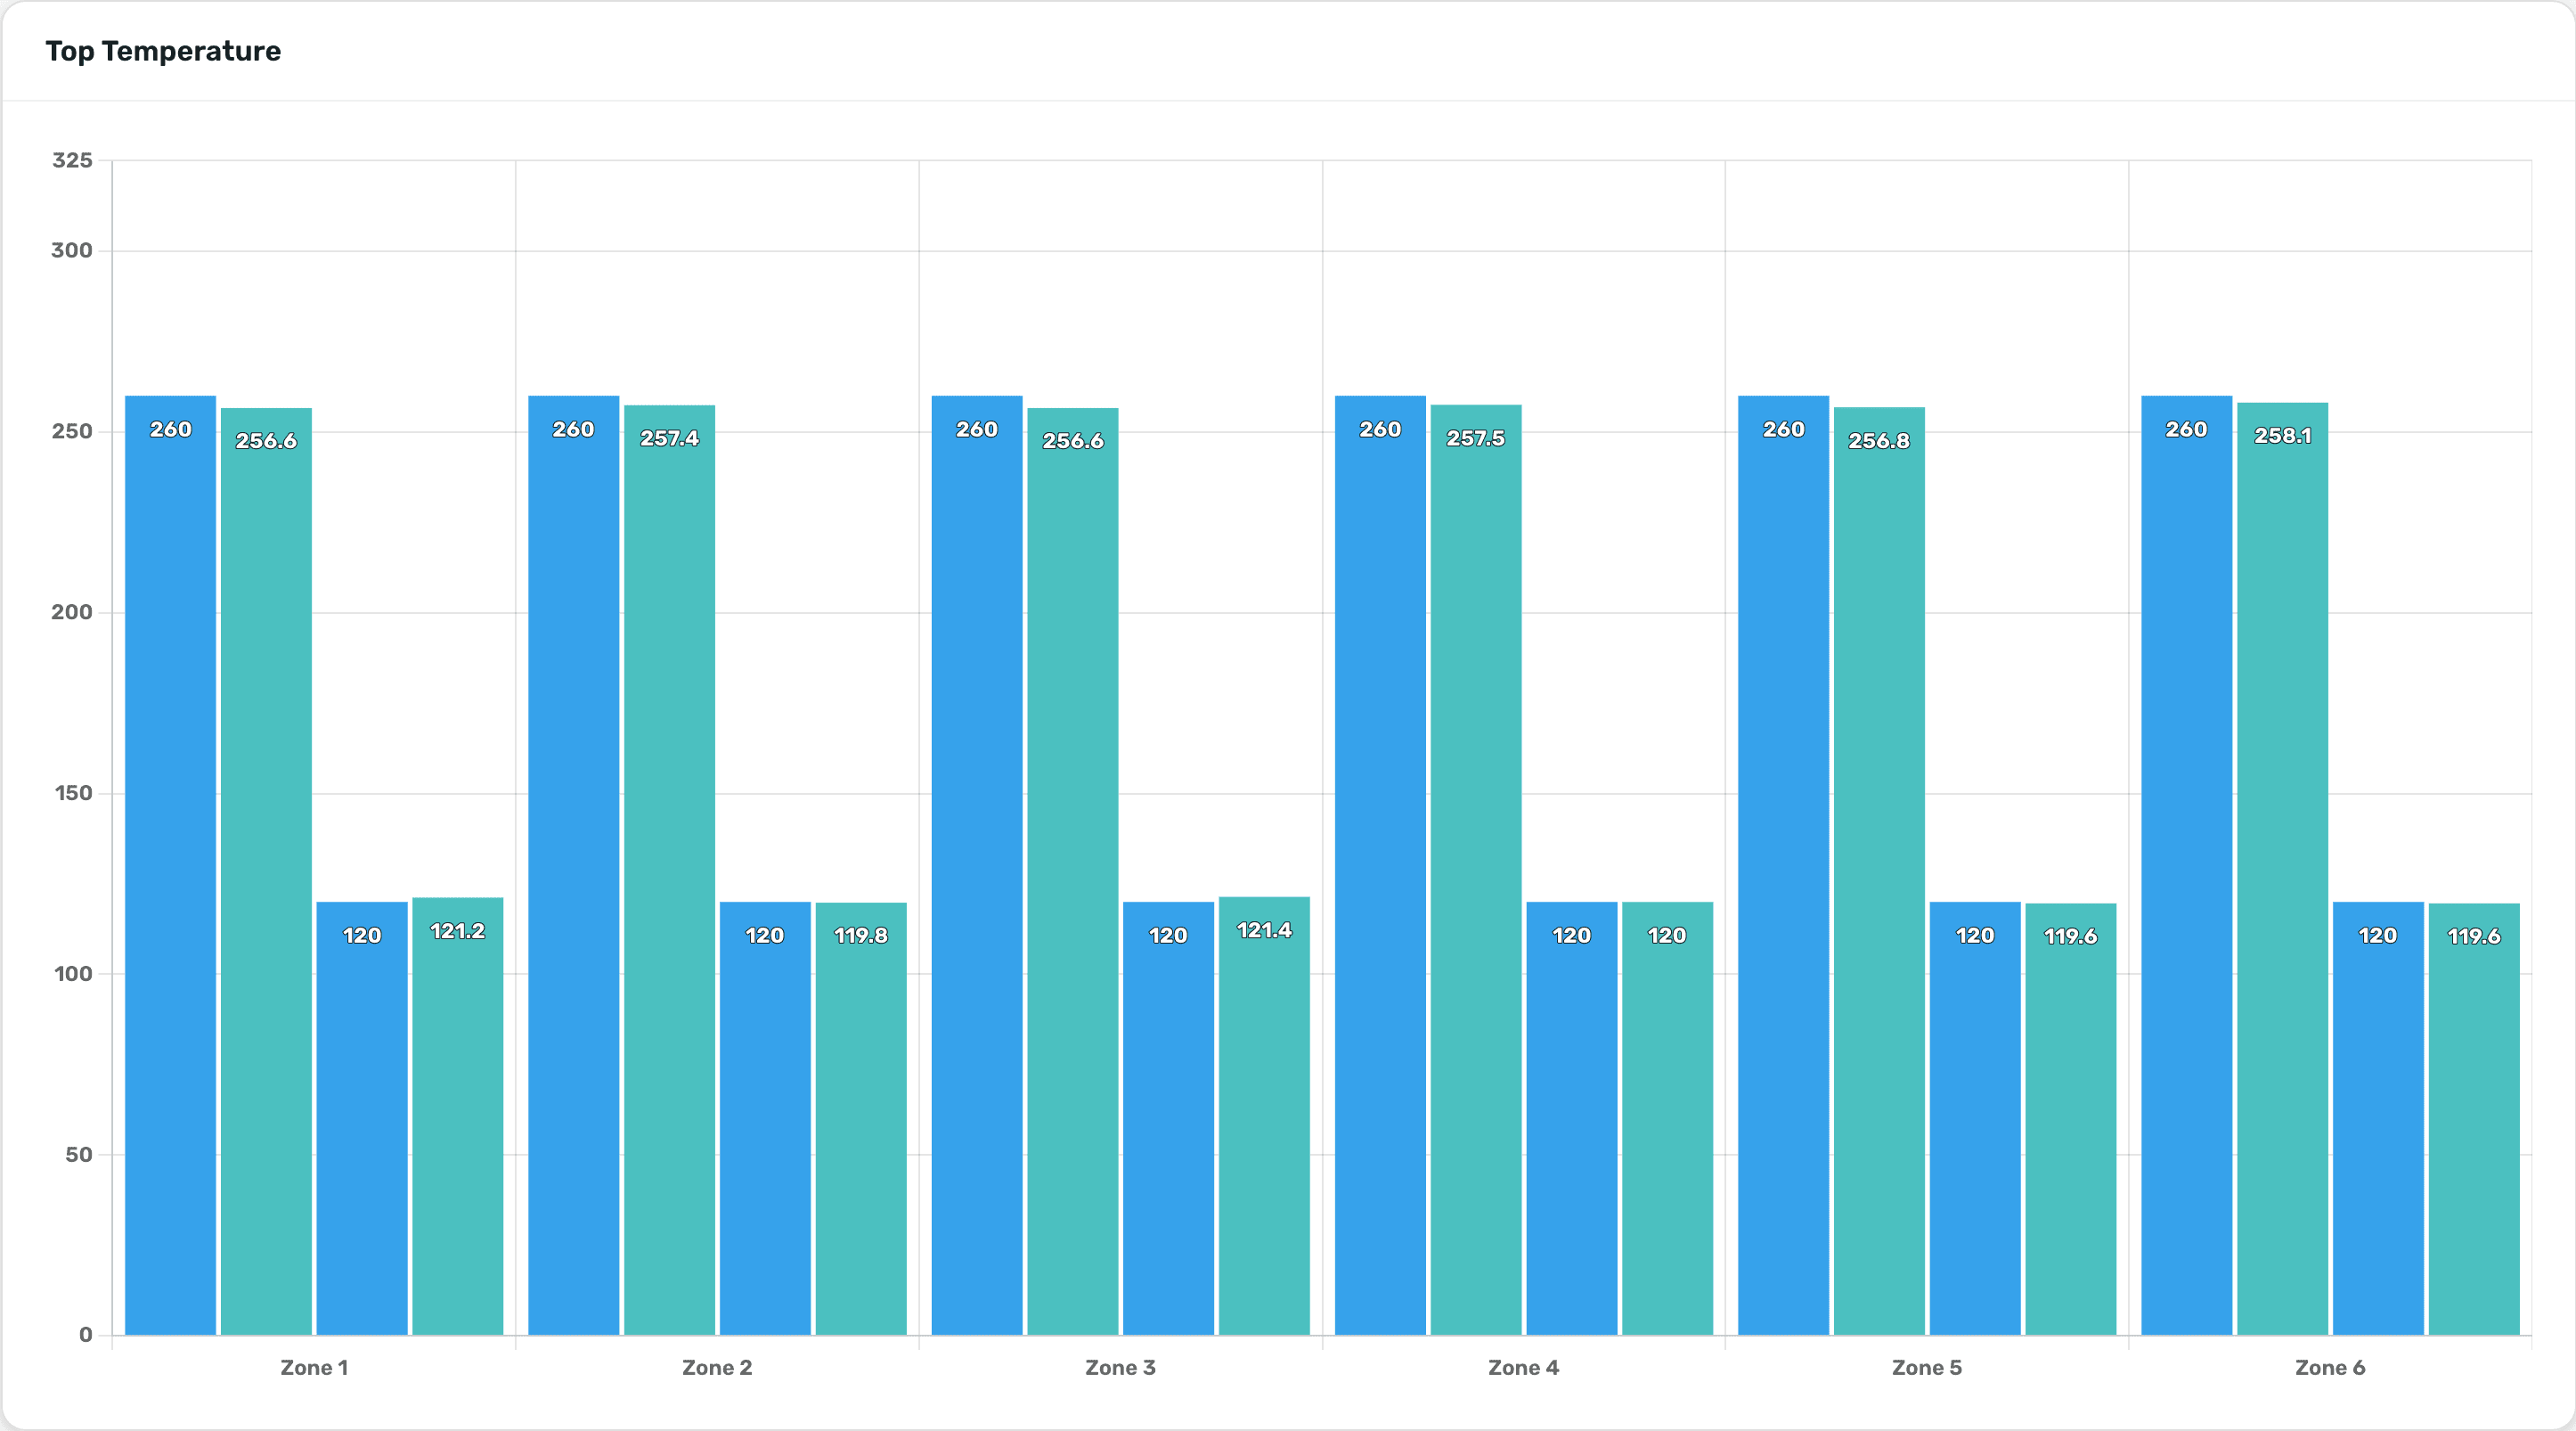
Bar graphs are organized in the same way as charts. A group holds sections, a section holds graphs, and each graph is made up of columns of parameters.
Groups
Groups are the top level of Bar Graphs. For example, you could create a group for each machine or production line you log with INDAQ.
If your project doesn't have any bar graph groups yet, the Bar Graphs page will prompt you to Create New Group. To add more groups later, select New Group at the bottom of the Bar Graphs sidebar.
To rename or delete a group, select Edit Group under the group in the sidebar. Deleting a group also deletes all of its sections and graphs.
Names must be between 3 and 255 characters long, and may contain letters, numbers, spaces and the symbols - _ ( ) % # @ ! $ ^ & * : ; . , /. Other characters, such as apostrophes, quotation marks and °, are not allowed. This applies to the names of groups, sections, graphs and columns, and to labels.
Sections
Sections split a group into pages of graphs that are shown together. For example, a group for an oven line could have a section for each oven, or a section for temperatures and another for motor speeds.
Select a group in the sidebar to see its sections. If the group doesn't have any yet, you will be prompted to Create New Section. After that, select New Section under the group in the sidebar to add more.
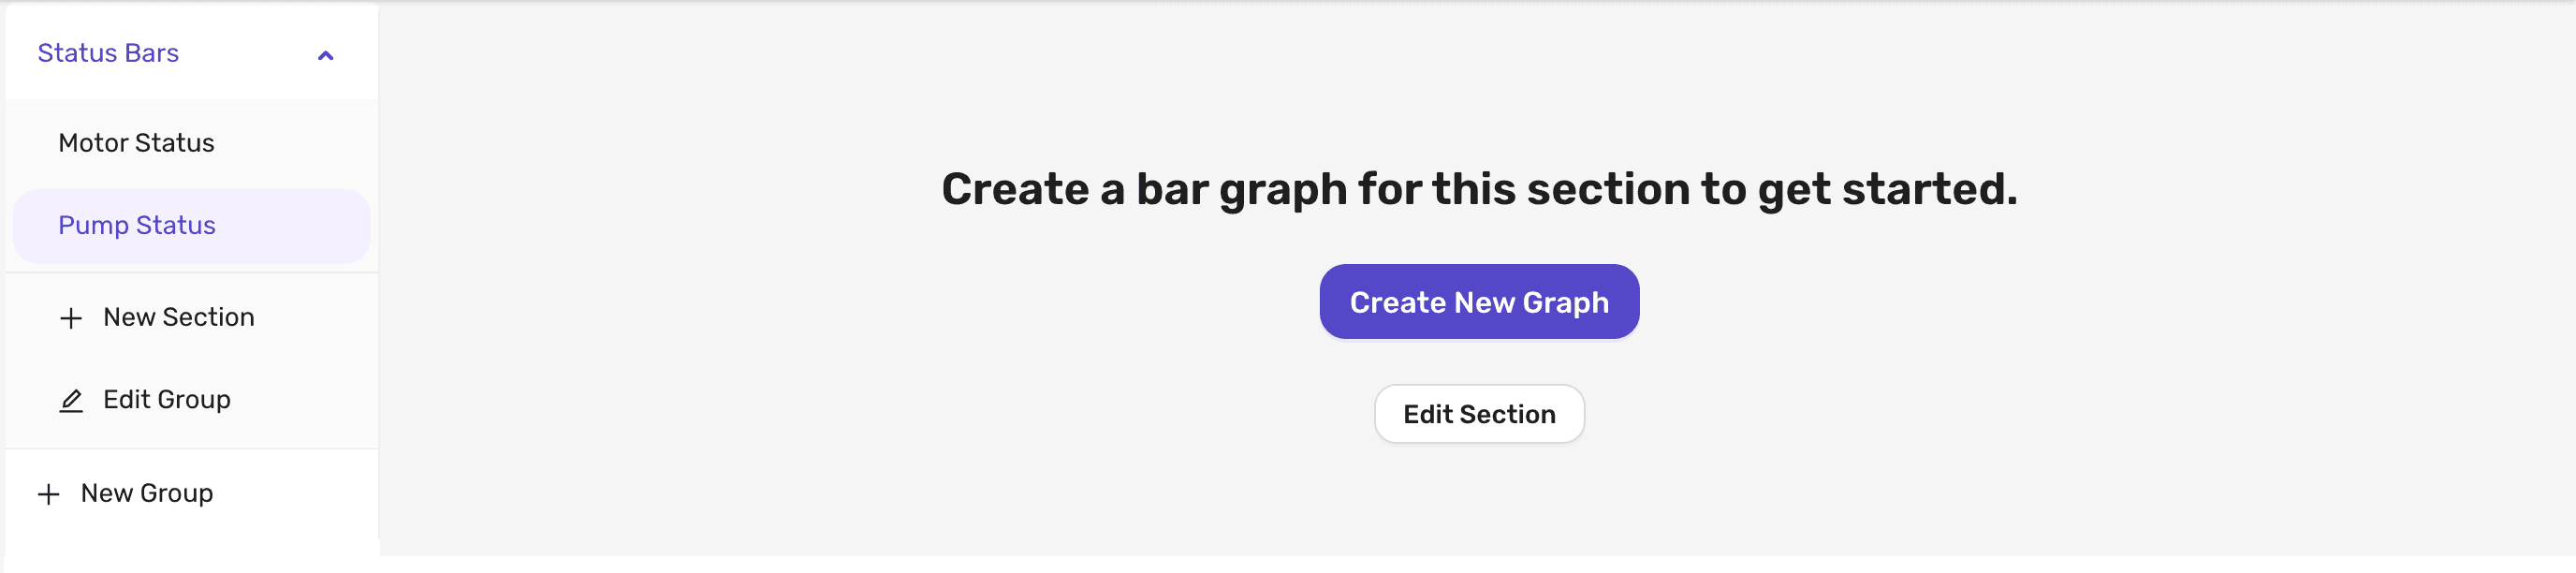
To rename or delete the section you are viewing, select Edit Section at the bottom of the page. Deleting a section also deletes its graphs.
INDAQ remembers the section you last viewed in each project, and opens it the next time you go to Bar Graphs from the same browser.
Graphs
To add a graph to a section, select Create New Graph at the bottom of the section, give the graph a Name, and select OK. Graphs fill the width of the page and are shown one below the other, in the order they were created.
A new graph is empty until you add columns to it.
Graph settings
Select the gear icon in the top right corner of a graph to open its Graph Settings. There is no save button: each change is saved automatically a moment after you stop typing.
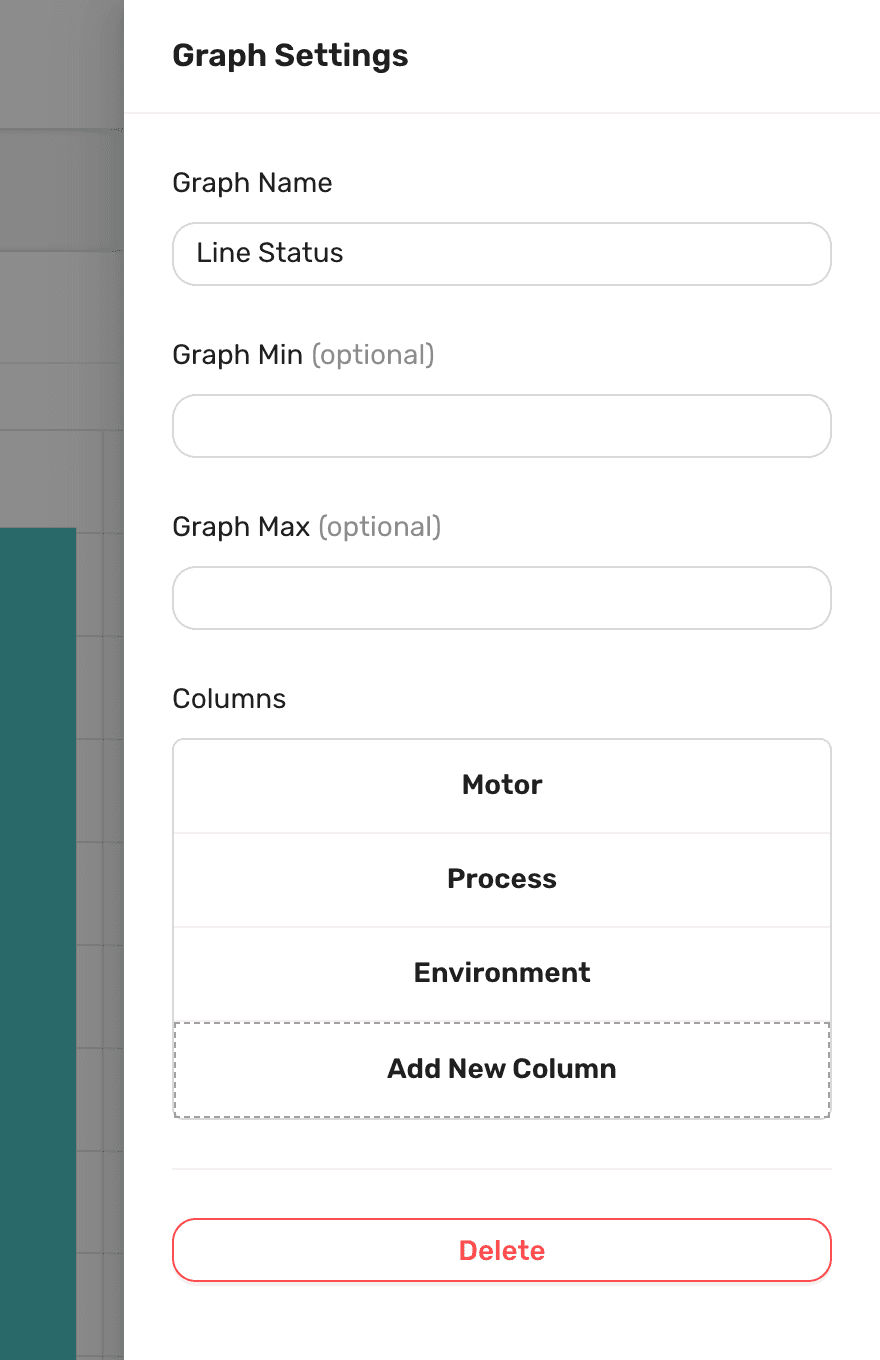
| Setting | Description |
|---|---|
| Graph Name | The name shown at the top of the graph. |
| Graph Min | Optional. The lowest value shown on the graph's axis. |
| Graph Max | Optional. The highest value shown on the graph's axis. |
| Columns | The graph's columns. Select a column to edit it, or select Add New Column to add one. |
Without a Graph Min or Graph Max, the axis starts at 0 and its maximum adjusts to fit the values displayed.
To delete the graph, select Delete at the bottom of its Graph Settings.
Columns
Each column is a cluster of bars along the bottom of the graph, labelled with the column's name. Every parameter you add to a column adds one bar to it. In the graph at the top of this page, each zone is a column, and the zone's parameters are its bars.
To add a column:
- Open the graph's Graph Settings.
- Under Columns, select Add New Column.
- Enter a Name for the column, then select Add.
Select a column in the list to open Edit Column, where you can rename the column, add and remove its parameters, or Delete it. Columns appear in the graph in the order they were added, as do the bars within each column.
Adding parameters
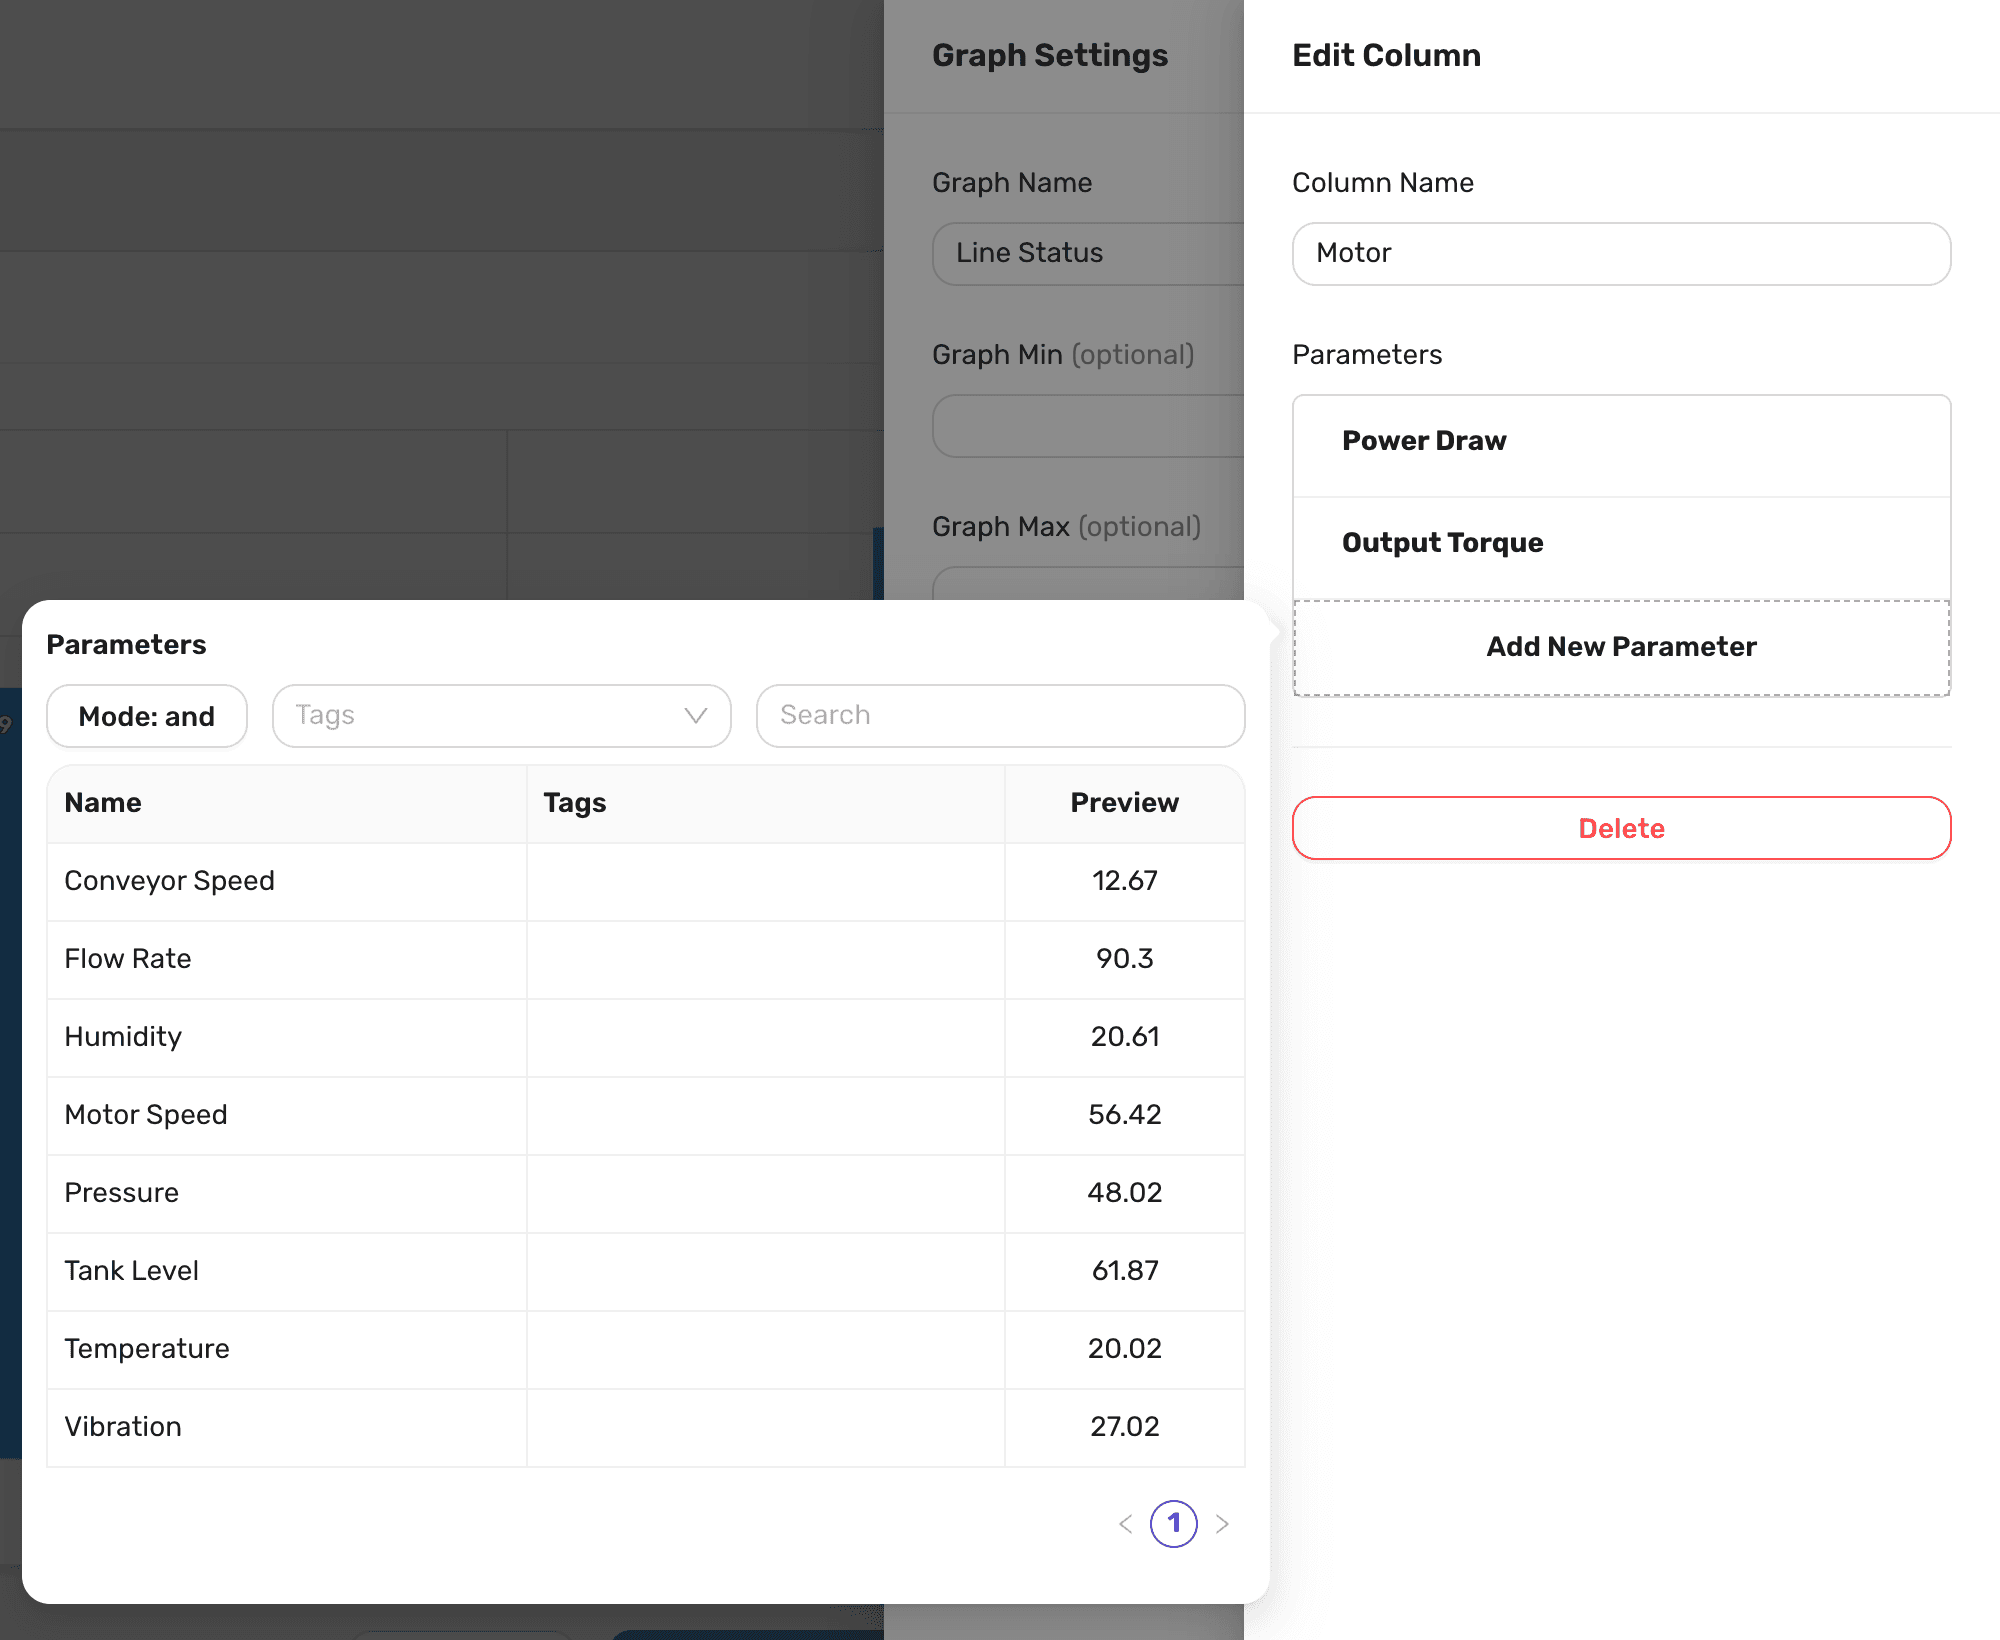
- In Edit Column, select Add New Parameter.
- Find the parameter you want. Use the Tags dropdown to filter the list by tag, and the Search input to filter it by name. When you select more than one tag, the mode toggle switches between
and, where a parameter must have all of the tags, andor, where any one of them is enough. - Select a parameter to add it to the column. The list stays open, so you can select several parameters in a row.
The Preview column in the list shows each parameter's latest value. Parameters that are already in the column are not listed.
Labels
Each bar is named after its parameter. To use a different name, select the parameter under Parameters in Edit Column and enter a Label. Labels are shown when you hover over a bar.
To remove a parameter from the column, select it and choose Delete.
Viewing bar graphs
Each bar shows the most recent value INDAQ has received for its parameter, and values above zero are also printed on the bar. While a section is open, INDAQ checks for new values every 30 seconds.
Hover over a bar to see the name of its column, the parameter's name or label, and its value.
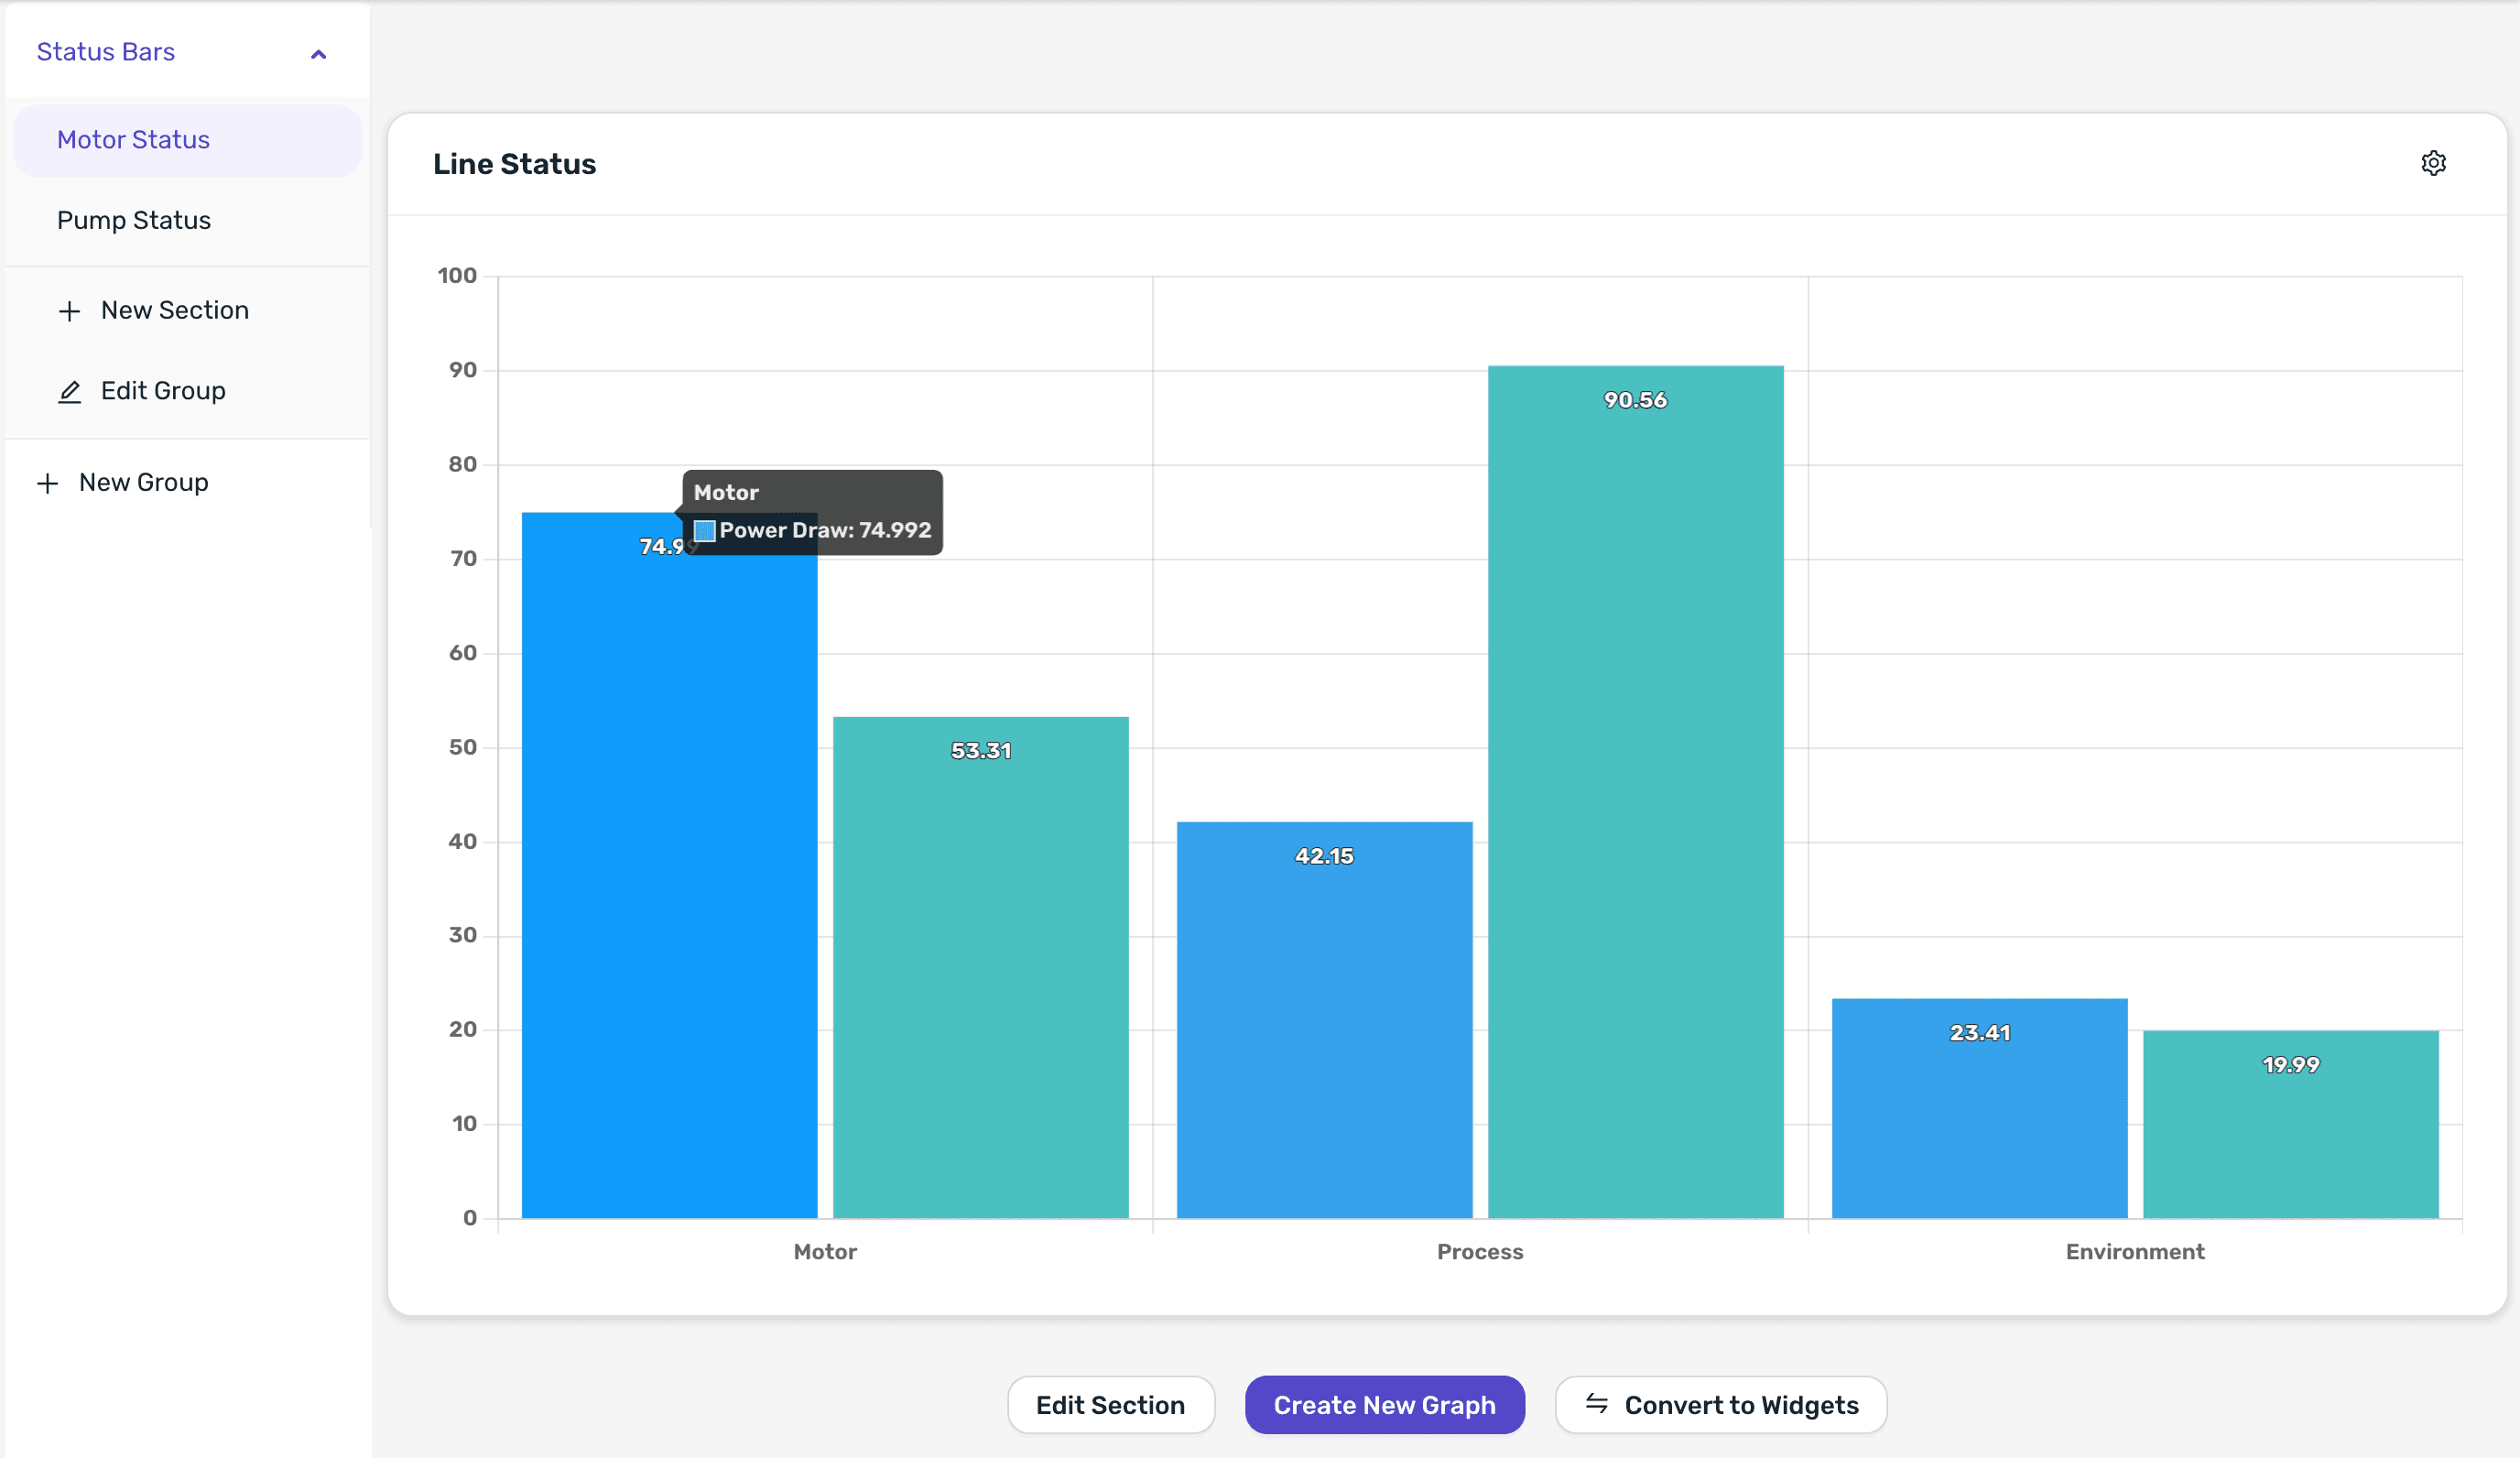
Bar graphs do not have a time range. To see how values have changed over time, add the same parameters to a chart.
A bar keeps showing the last value INDAQ received, even if its parameter has since stopped sending data. If a value looks out of date, check that the Interface collecting it is online. A parameter that has never sent any data is shown as a thin bar at 0.
Converting to a beta dashboard
The graphs in a section can be copied into a beta dashboard, where they can be arranged alongside other kinds of widgets.
- Open the section and select Convert to Widgets at the bottom of the page.
- Enter a Dashboard Name, then select Convert.
INDAQ creates a new dashboard with a Bar Chart widget for each graph in the section, and opens it. The section itself is left unchanged, and later changes to one are not copied to the other.
Permissions
Organization Owners and Managers can create, change, convert and delete bar graphs. Everyone else in the organization can view them. See Member Roles for more about roles.