Dashboards
Dashboards show the latest values of your parameters as a grid of tiles, giving you an at-a-glance view of a machine or process. They are well suited to a screen mounted beside a production line.
Each tile shows the value of one parameter. A tile can show the value as a number with its unit, such as 301.62 °F, or translate it into a state, such as a green On or a red Off.
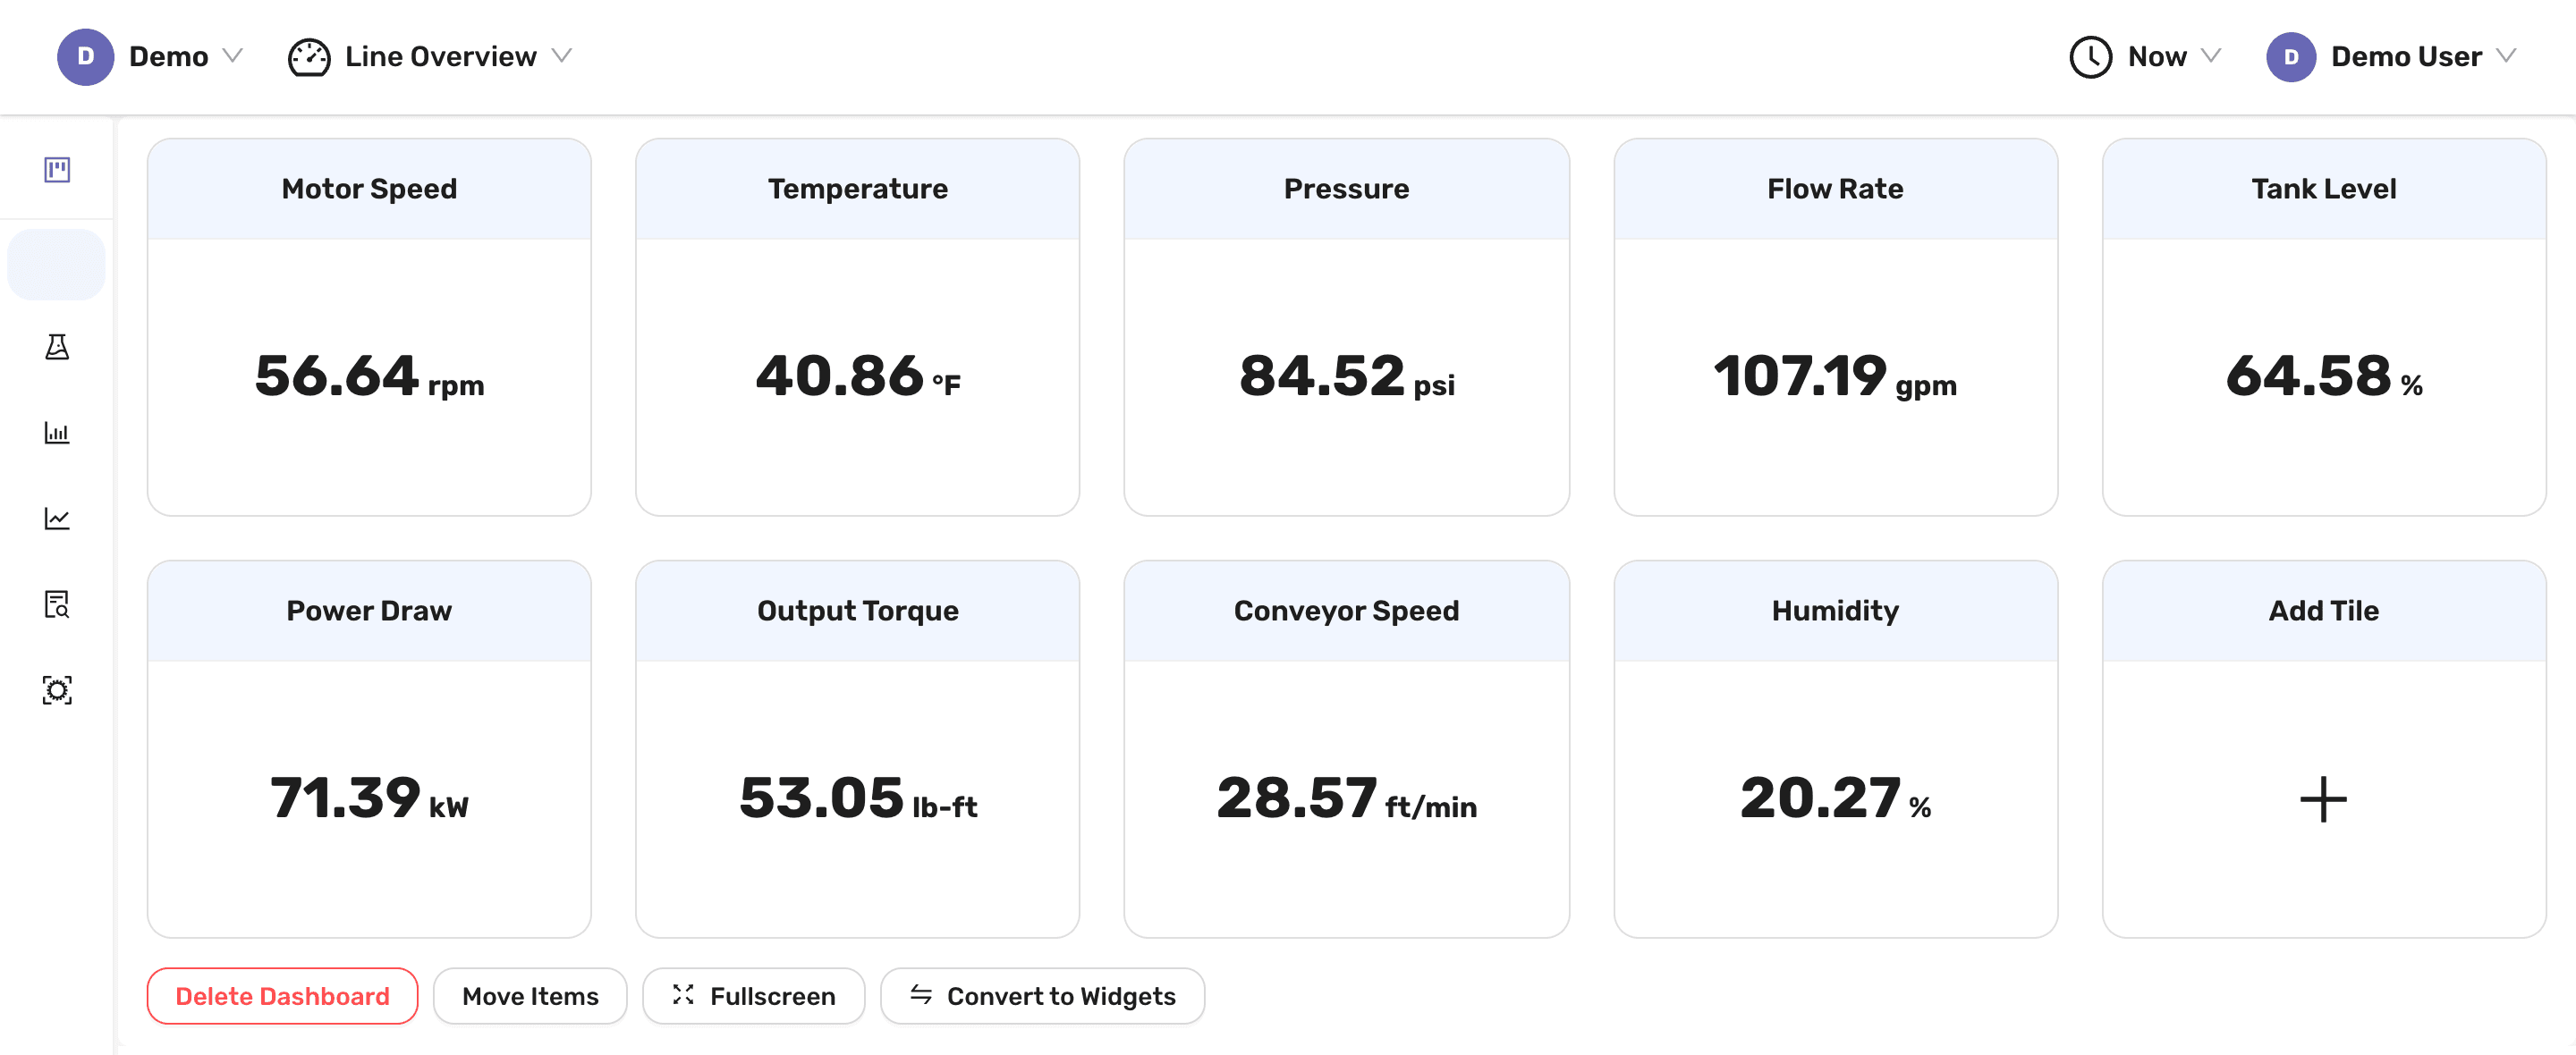
INDAQ also offers Dashboards (Beta), a newer kind of dashboard that can mix numbers with line, area and bar charts. Any dashboard can be copied into a beta dashboard with Convert to Widgets.
Creating a dashboard
If your project doesn't have any dashboards yet, the Dashboards page will prompt you to Create New Dashboard.
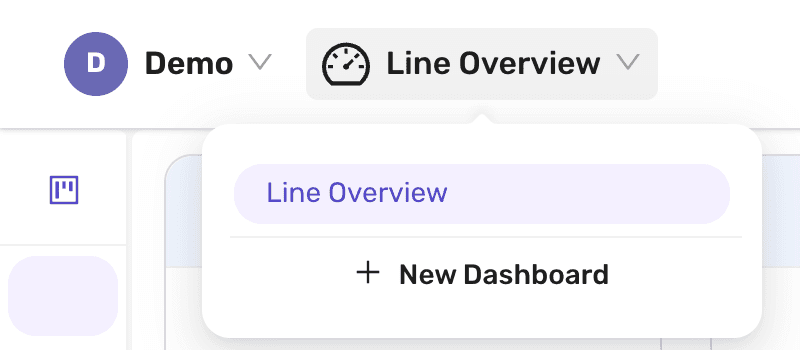
Once you have a dashboard, the name of the dashboard you are viewing is shown in the bar at the top of the page, next to your organization's name. Select it to see a list of all of the project's dashboards, then select New Dashboard at the bottom of the list.
Give the dashboard a Name and select OK. The new dashboard opens straight away, ready for its first tiles.
Dashboard names must be between 3 and 255 characters long, and may contain letters, numbers, spaces and the symbols - _ ( ) % # @ ! $ ^ & * : ; . , /. A dashboard cannot be renamed once it has been created.
Switching dashboards
Select the dashboard's name at the top of the page to see the list of dashboards, and select one to open it.
To change the order of the list, drag a dashboard's name to a new place in it. When you open Dashboards, the first dashboard in the list is shown.
Tiles
To add a tile, select Add Tile, the last tile on the dashboard. To change a tile later, hover over it and select the pencil button in its bottom right corner.
| Setting | Description |
|---|---|
| Name | The title shown at the top of the tile. If you choose a parameter before entering a name, the parameter's name is filled in for you. |
| Parameter | The parameter whose value the tile shows. |
| Display Type | Numeric shows the value as a number. States shows a label and color for each value you define. |
| Displayed Unit | For Numeric tiles, the unit shown after the value, such as °F, psi or cycles. |
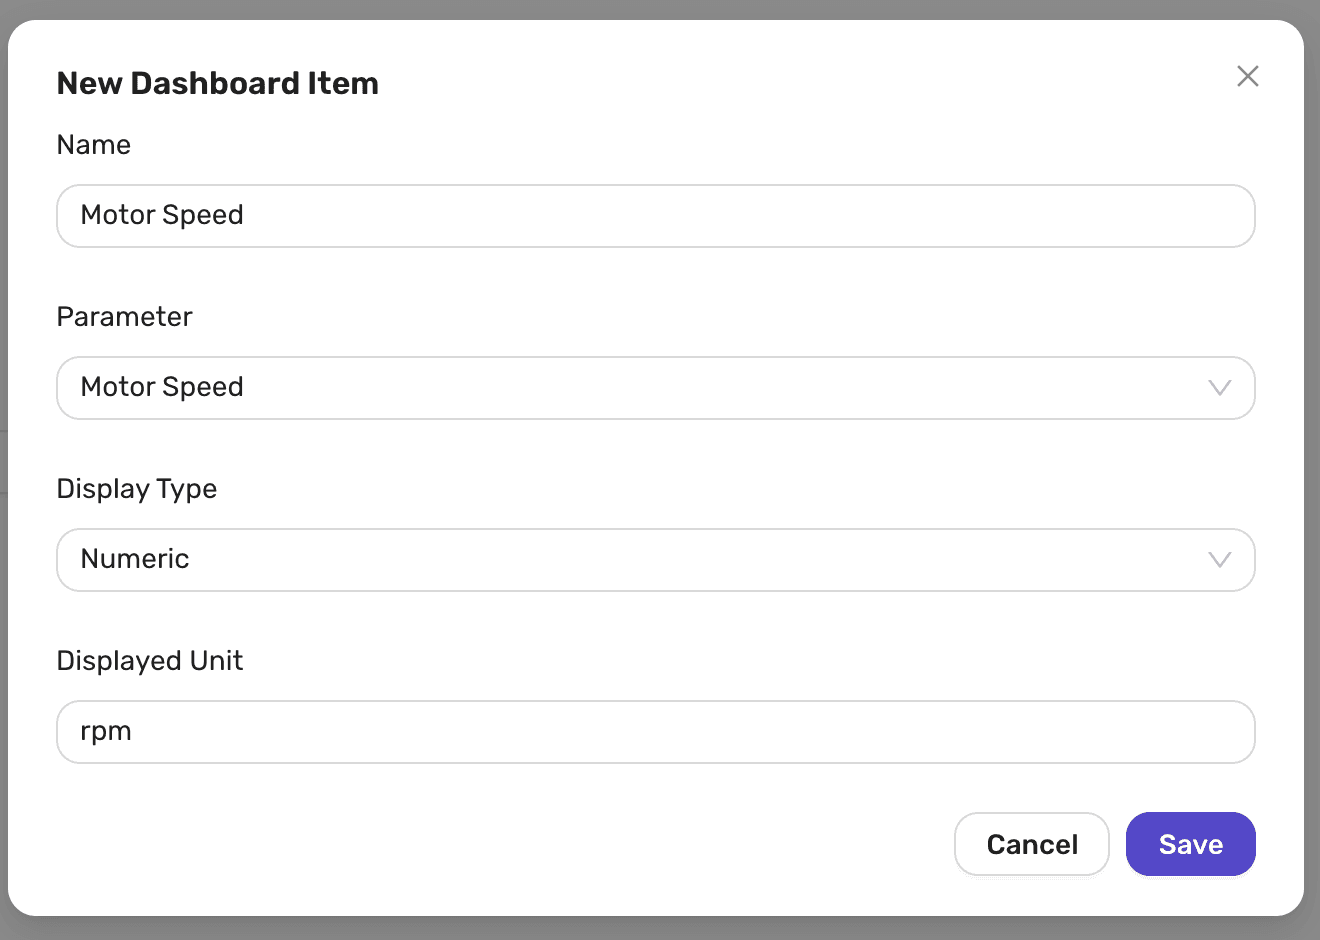
To choose a Parameter, select the field to open a list of your project's parameters. Use the Tags dropdown to filter the list by tag, and the Search input to filter it by name. When you select more than one tag, the mode toggle switches between and, where a parameter must have all of the tags, and or, where any one of them is enough. The Preview column shows each parameter's latest value. Select a parameter to choose it.
Select Save to add the tile to the end of the dashboard. To remove a tile, open it and select Delete.
Numeric tiles
Numeric tiles show the parameter's latest value, rounded to two decimal places, followed by the Displayed Unit.
State tiles
State tiles turn a value into something easier to read. They are ideal for parameters that report a machine's state as a number, such as a heater that reports 1 when it is on and 0 when it is off.
Each state has a value, a label, and optionally a color. To add a state, fill in the empty row at the bottom of the list and select Add. Select Remove to delete a state.
When the parameter's value is exactly equal to one of the state values, the tile shows that state's label, filled with its color. When the value doesn't match any of the states, the tile shows the value itself.
The colors available are Red, Green, Yellow, Blue, Grey, White and Black.
States must match the value exactly, so they work best with whole numbers. A value such as 1.0001 will not match a state of 1.
State labels must be between 2 and 64 characters long, start with a letter, and contain only letters, numbers, spaces, - and _.
Arranging tiles
All tiles are the same size. They fill the dashboard from left to right in rows, with between three and six tiles to a row depending on the width of your window.
To rearrange them, select Move Items at the bottom of the dashboard, then drag a tile onto the tile whose place it should take. Select Stop Moving when you are done.
Viewing dashboards
Tiles show the most recent value INDAQ has received for each parameter, and update every 10 seconds.
Out of date values
If a tile's parameter hasn't sent a value in the last 24 hours, or has never sent one, the tile's title turns gold. A warning icon also appears at the top of the page, next to the dashboard's name, when any tile's value is more than 24 hours old.
This usually means that the Interface collecting the data is offline, or that the parameter is no longer being recorded.
Viewing an earlier time
The time selector at the top right of the page shows Now while the dashboard is showing live values. To see what the tiles showed at an earlier time, select it, pick a date and time, and select OK. Each tile then shows the last value its parameter had at that time, and the dashboard stops updating.
To return to live values, open the time selector and select Now.
Fullscreen
Select Fullscreen at the bottom of the dashboard to fill the screen with its tiles, for example on a wall-mounted display. Select Exit Fullscreen, or press Esc, to return.
Converting to a beta dashboard
Any dashboard can be copied into a beta dashboard, where you can resize its tiles and add charts alongside them.
- Open the dashboard and select Convert to Widgets at the bottom of the page.
- Enter a Dashboard Name, then select Convert.
INDAQ creates a new dashboard with a Number widget for each tile, and opens it. State tiles keep their states. Displayed units are not copied, so add them to each widget afterwards if you need them.
The original dashboard is left unchanged, and later changes to one are not copied to the other.
Deleting a dashboard
To delete the dashboard you are viewing, select Delete Dashboard at the bottom of the page. Its tiles are deleted along with it.
Permissions
Organization Owners and Managers can create, change, rearrange, convert and delete dashboards. Everyone else in the organization can view them, including choosing an earlier time and using fullscreen. See Member Roles for more about roles.